

YOMPI
YOMPI steht für Your Own Math and Plotting Interface. Es ist der Teil von MIRCO für Diagramme.
Was es zeichnet
- Linien, Punkte, Histogramme und Heatmaps.
- Ausgabe als SVG oder PNG. Dieselbe Abbildung ergibt jedes Mal exakt dieselben Bytes.
- Achsenteilung bei 1, 2 und 5 mal einer Zehnerpotenz, ohne Rundungsfehler von Gleitkommazahlen in der Beschriftung.
- Text in einem PNG wird mit einer eigenen Pixelschrift (5 × 7) gesetzt, sodass kein Font auf dem System nötig ist.
Eine Figure ist ein linearer Wert: Man legt sie mit figure an, füllt sie mit addLine, addScatter, addHistogram oder setHeatmap, zeichnet sie mit renderSvg oder renderPng und beendet sie mit destroyFigure.
Ein Diagramm
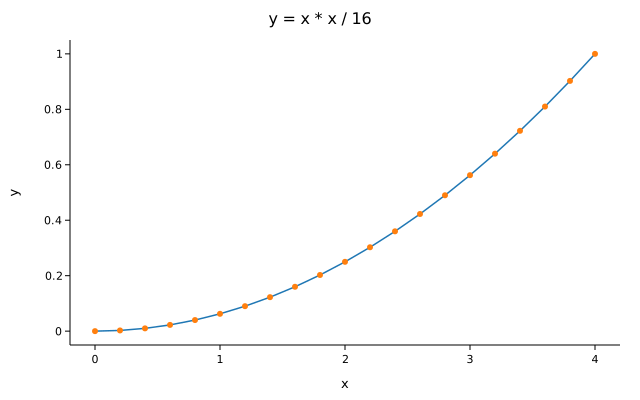
Dieses Programm wurde für diese Seite geschrieben, nach dem Vorbild des Linien-Tests von YOMPI. Es wurde im MIRCO-Paket übersetzt und ausgeführt, und das Diagramm unten ist genau das, was es ausgegeben hat.
Datei: YompiPlot.hiq
import Standard.Buffer (Buffer, allocateEmpty, insertBack, destroyFree, wholeSpan);
import Standard.String (String, asSpan, destroyString);
import Mirco.Element (Element);
import Mirco.Array (NdArray, fromSpan, destroyNdArray);
import Mirco.Yompi (Figure, figure, destroyFigure, setTitle, setXLabel, setYLabel, addLine, addScatter, addHistogram, renderSvg);

module body Example.YompiPlot is
    generic [R: Region]
    function vector(values: &[Buffer[Float64], R]): NdArray[Float64] is
        var shape: Buffer[Index] := allocateEmpty();
        insertBack(&!shape, spanLength(wholeSpan(values)));
        let made: NdArray[Float64] := fromSpan(wholeSpan(&shape), wholeSpan(values));
        destroyFree(shape);
        return made;
    end;

    function main(): ExitCode is
        var xs: Buffer[Float64] := allocateEmpty();
        var ys: Buffer[Float64] := allocateEmpty();
        var i: Index := 0;
        var step: Float64 := 0.0;
        while i <= 20 do
            insertBack(&!xs, step);
            insertBack(&!ys, (step * step) / 16.0);
            step := step + 0.2;
            i := i + 1;
        end while;
        let x: NdArray[Float64] := vector(&xs);
        let y: NdArray[Float64] := vector(&ys);
        var f: Figure := figure(640, 400);
        addLine(&!f, &x, &y, 2062260);
        addScatter(&!f, &x, &y, 16744206);
        setTitle(&!f, "y = x * x / 16");
        setXLabel(&!f, "x");
        setYLabel(&!f, "y");
        let svg: String := renderSvg(&f);
        printLn(asSpan(&svg));
        destroyString(svg);
        destroyFigure(f);
        destroyNdArray(x);
        destroyNdArray(y);
        destroyFree(xs);
        destroyFree(ys);
        return ExitSuccess();
    end;
end module body.
Ausgabe von hilde compile YompiPlot.hiq --entrypoint=Example.YompiPlot:main --output=plot (Exit-Status 0):
keine
Ausgabe von ./plot > yompi-line.svg (Exit-Status 0):
3675 Byte SVG, unten abgebildet.
Quelltext der Sprache: github.com/heikozim/hilde.