

YOMPI
YOMPI = Your Own Math and Plotting Interface. It is the plotting part of MIRCO.
What it draws
- lines, points, histograms and heatmaps;
- as SVG or as PNG, the same figure giving the same bytes every time;
- ticks at 1, 2 and 5 times a power of ten, without the rounding error of a float in the label;
- texts in a PNG in a pixel font of its own, 5 by 7, so a PNG needs no font on the system.
A Figure is a linear value: it is made with figure, filled with addLine, addScatter, addHistogram or setHeatmap, rendered with renderSvg or renderPng, and ended with destroyFigure.
A plot
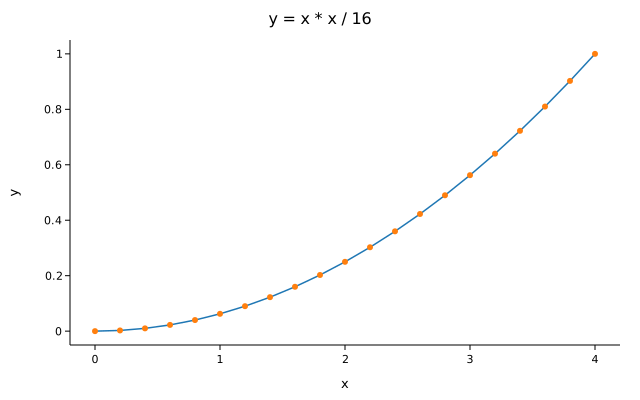
This programme was written for this page after YOMPI's test of a line; it was compiled inside the MIRCO package and run, and the plot below is what it wrote.
File: YompiPlot.hiq
import Standard.Buffer (Buffer, allocateEmpty, insertBack, destroyFree, wholeSpan);
import Standard.String (String, asSpan, destroyString);
import Mirco.Element (Element);
import Mirco.Array (NdArray, fromSpan, destroyNdArray);
import Mirco.Yompi (Figure, figure, destroyFigure, setTitle, setXLabel, setYLabel, addLine, addScatter, addHistogram, renderSvg);

module body Example.YompiPlot is
    generic [R: Region]
    function vector(values: &[Buffer[Float64], R]): NdArray[Float64] is
        var shape: Buffer[Index] := allocateEmpty();
        insertBack(&!shape, spanLength(wholeSpan(values)));
        let made: NdArray[Float64] := fromSpan(wholeSpan(&shape), wholeSpan(values));
        destroyFree(shape);
        return made;
    end;

    function main(): ExitCode is
        var xs: Buffer[Float64] := allocateEmpty();
        var ys: Buffer[Float64] := allocateEmpty();
        var i: Index := 0;
        var step: Float64 := 0.0;
        while i <= 20 do
            insertBack(&!xs, step);
            insertBack(&!ys, (step * step) / 16.0);
            step := step + 0.2;
            i := i + 1;
        end while;
        let x: NdArray[Float64] := vector(&xs);
        let y: NdArray[Float64] := vector(&ys);
        var f: Figure := figure(640, 400);
        addLine(&!f, &x, &y, 2062260);
        addScatter(&!f, &x, &y, 16744206);
        setTitle(&!f, "y = x * x / 16");
        setXLabel(&!f, "x");
        setYLabel(&!f, "y");
        let svg: String := renderSvg(&f);
        printLn(asSpan(&svg));
        destroyString(svg);
        destroyFigure(f);
        destroyNdArray(x);
        destroyNdArray(y);
        destroyFree(xs);
        destroyFree(ys);
        return ExitSuccess();
    end;
end module body.
Output of hilde compile YompiPlot.hiq --entrypoint=Example.YompiPlot:main --output=plot (exit status 0):
none
Output of ./plot > yompi-line.svg (exit status 0):
3675 bytes of SVG, shown below.
Source of the language: github.com/heikozim/hilde.